Image 1
This was initially posted to reddit on May 14, 2016.
References 4,5,6,7 to externally hosted images were changed to inline images.
Data summaries are available via the link in Appendix A.
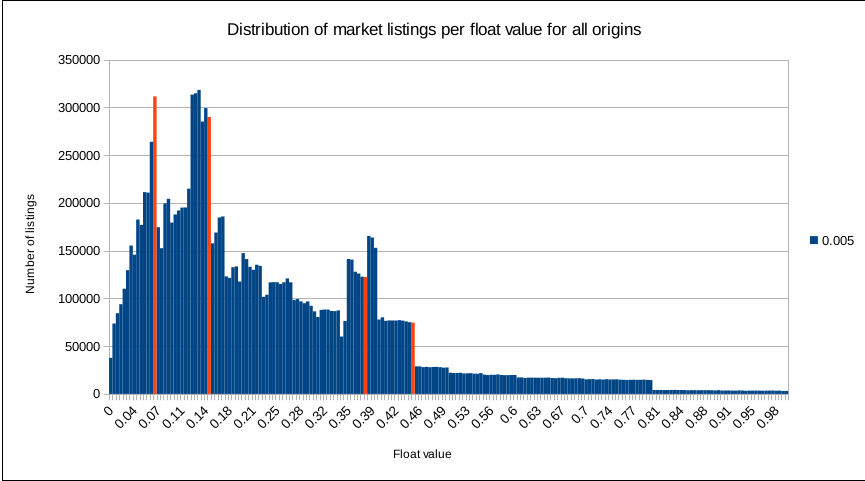
The data summaries given are divided into reference points between zero and one per one one-hundredth float value. A count is made for a given delta for each reference point, once below, and once above. When delta=0.005, the entire range of float values is covered from zero to one.
It is assumed that other types of items will be under-represented as well; for example, it is assumed but not proven that low float items (0.000x factory new, 0.150x minimal wear, etc), are more likely to be traded in person than listed on the community market. Items listed in a foreign currency are giving a different listing when the exchange rate is recalculated (once daily), so these items have the potential to be counted more than once.
There is a lower bound of at least 0.0004% error in a float value being entirely incorrect when recorded.
Sorting all float values with delta=0.005 gives the result shown in Image 1 (note that the last interval for each exterior in this and all following charts is highlighted). One immediate observation is that items on the upper end of Factory New, Minimal Wear, and Well-Worn are much more frequently observed on the community market than items with float values just slightly higher. Stated differently, items with the lowest floats found in Minimal Wear, Field-Tested, and Battle-Scarred are much less likely to be seen on the community market. Another observation is the sharp decline found in number of items seen at 0.8 float value. This is probably due to the fact that of the 719 items tracked, 173 have a float value range of 0.06 to 0.80, which is one of the most common ranges (only items which range from 0 to 1 are considered below).
Image 1
The distribution for float values from all origins is given in the following table.
    FN     2187306    15.55%
    MW     3715762    26.41%
    FT     5359189    38.10%
    WW     1326601     9.43%
    BS     1478572    10.51%

    TOTAL 14067430
A chart showing percent of listings found above each float value is given at Image 2 and the same chart is given on log scale at Image 3. The median float value for all observed listings is between 0.18 and 0.19.
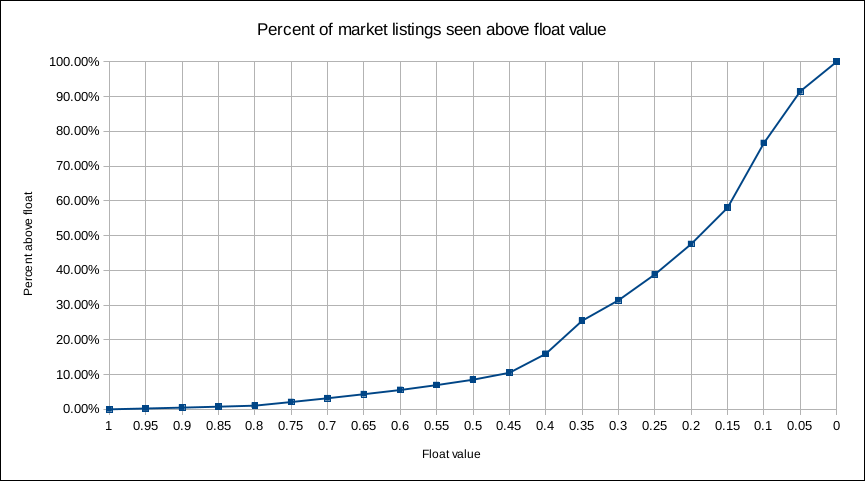
Image 2
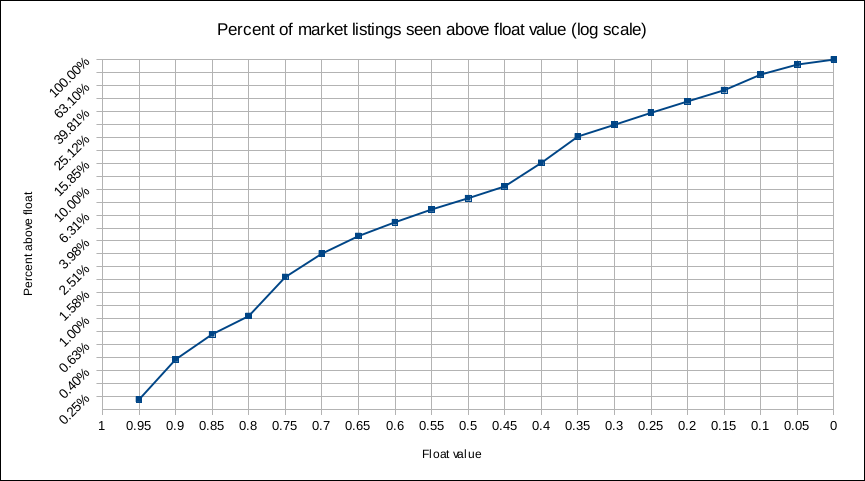
Image 3
A summary for each item origin will be outlined below. See Appendix C for the count of listings per origin.
A summary of the "Crafted" origin can be seen at Image 4 There is an unusual peak found just below the cutoff for Factory New. There is a local maximum centered around 0.27 worth further consideration (another post). The last observation is how heavily weighted the chart is towards lower values, which shows how tradeup float values can become smaller or stay the same, but can never increase in value (this is due to how the tradeup formula works).
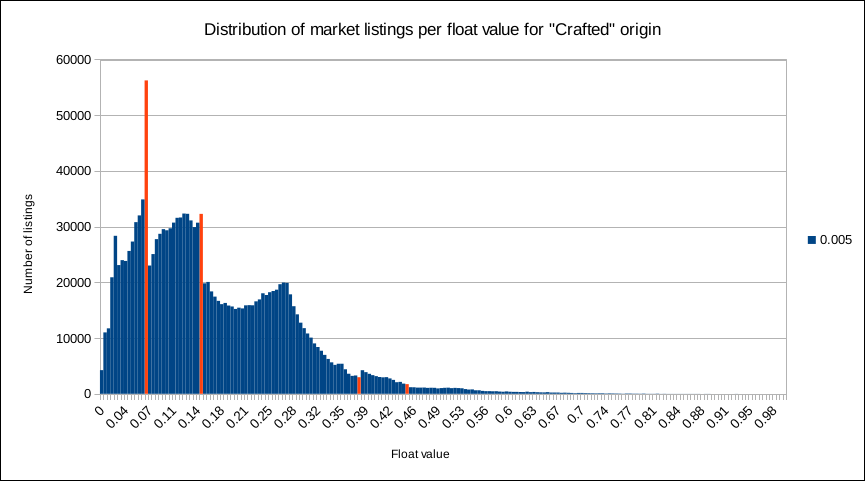
Image 4
The distribution for float values for "Crafted" origin is given in the following table.
    FN     354074  23.51%
    MW     475818  31.59%
    FT     604818  40.15%
    WW      40180   2.67%
    BS      31360   2.08%

    TOTAL 1506250
A summary of the "Found in Crate" origin can be seen at Image 5 The interval with the most number of listings seen is just below the cutoff for Factory New. The distribution of float values for the Factory New interval follows an increasing progression; that is, items with a float value of 0-0.005 were seen least frequently while items with a float value of 0.065-0.007 were seen the most frequently. The cause of this is unknown, due to either 1) better float values persisting on the market for shorter periods of time and being observed less frequently, 2) better float values not being posted on the community market, i.e., an item owner decides to keep rather than sale an item, or 3) better float values are less likely to be obtained from opening crates.
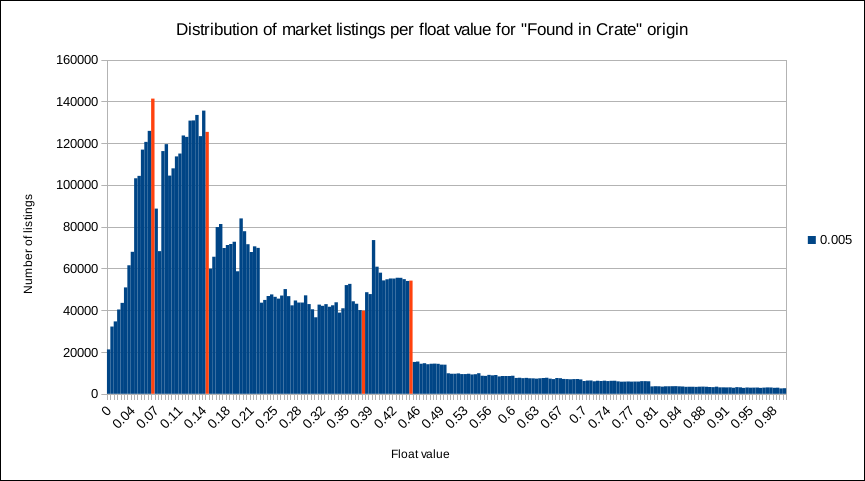
Image 5
Field-Tested represents the largest group of exteriors, comprising 35.5% of listings seen, and interestingly lower values were more common than higher ones. Well-Worn and Battle-Scarred exteriors were the least seen exterior, both only accounting for 11.4% and 10.5% of listings seen respectively. The distribution for float values for "Found in Crate" origin is given in the following table.
    FN    1064489  15.49%
    MW    1859615  27.07%
    FT    2440018  35.51%
    WW     782278  11.39%
    BS     724365  10.54%

    TOTAL 6870765
The remaining four item origins -- "Timed Drop," "Gifted," "Quest Reward" (operation), and "Level Up Reward" all follow similar distributions and will be discussed as a group. The "Timed Drop" origin summary can be seen at Image 6 and the remaining charts are available in Appendix B. Boundaries between exteriors are the most seen listings with the exception of the Well-Worn to Battle-Scarred boundary. Are item drops more likely to be near exterior boundaries, or is this an artifact of users selling items on the market? That question can only be partially answered with this data, but must be the subject of a future post. Other points worth noting: "Quest Reward" is the only origin in which Well-Worn appears more frequently than Battle-Scarred; "Gifted" is the only origin in which Factory New is the least frequently seen exterior. The distribution for these origins is given in the tables below.
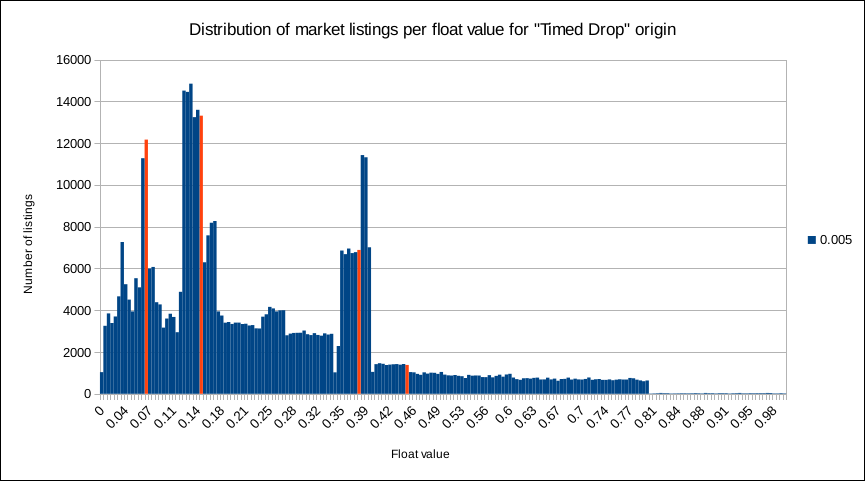
Image 6
          Timed Drop         Gifted           Quest Reward      Level Up Reward
    FN     74908  15.30%  |  1633   9.84%  |  26804  15.07%  |   672914  13.31%
    MW    126780  25.89%  |  3622  21.89%  |  49170  27.64%  |  1213868  24.01%
    FT    186612  38.11%  |  7379  44.47%  |  54191  30.46%  |  2085135  41.24%
    WW     44929   9.18%  |  1739  10.48%  |  24812  13.95%  |   437449   8.65%
    BS     56395  11.52%  |  2220  13.38%  |  22921  12.88%  |   646325  12.78%

    Total 489624          | 16593          | 177898          |  5055691
As some items have a limited float value range, it is worth limiting the data set to only those items which can vary the float value from zero to one. Nineteen of the most frequently seen items were counted individually across all origins, the result of which is available in Appendix A. The distributions for these items were very similar so only one chart will be presented, which is for the most frequently seen item, the AK-47 Elite Build: Image 7. Immediately obvious are the missing data values. For the nineteen items considered, no listings were observed for the following float ranges (within a margin of error): 0.07-0.08, 0.15-0.16, 0.38-0.39, and 0.45-0.46. This was an unexpected finding, and the number of other items which have missing float values is an open question. Another observation is that the float values are very uniformly distributed within each exterior. If this is the case for every item, then the skewed distribution for all items is a result of the different ranges that each item has; this was not confirmed. The distribution of float values follows a more normal distribution with Field-Tested being the most frequently seen item. A summary is given in the table below.
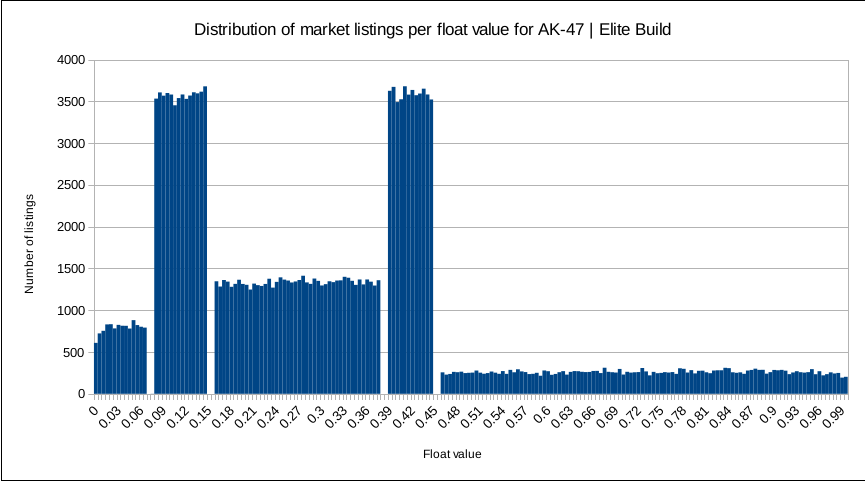
Image 7
    FN     11058  5.79%
    MW     50055  26.19%
    FT     58790  30.76%
    WW     43131  22.56%
    BS     28111  14.71%

    TOTAL 191145
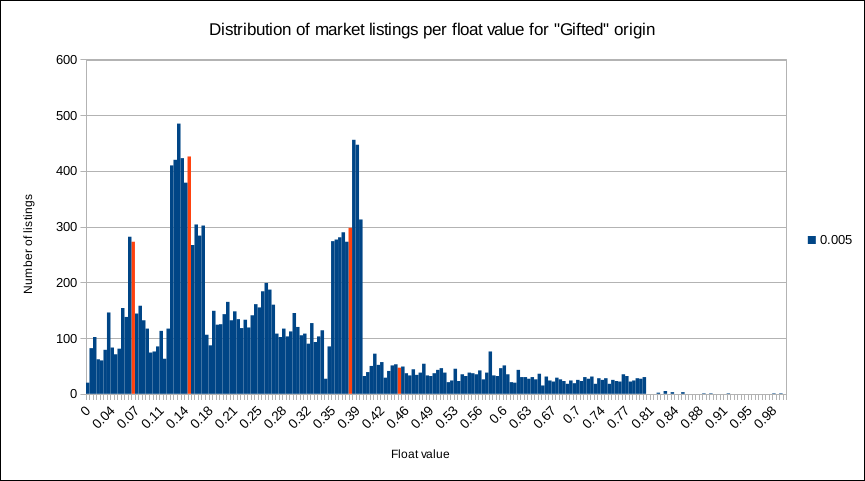
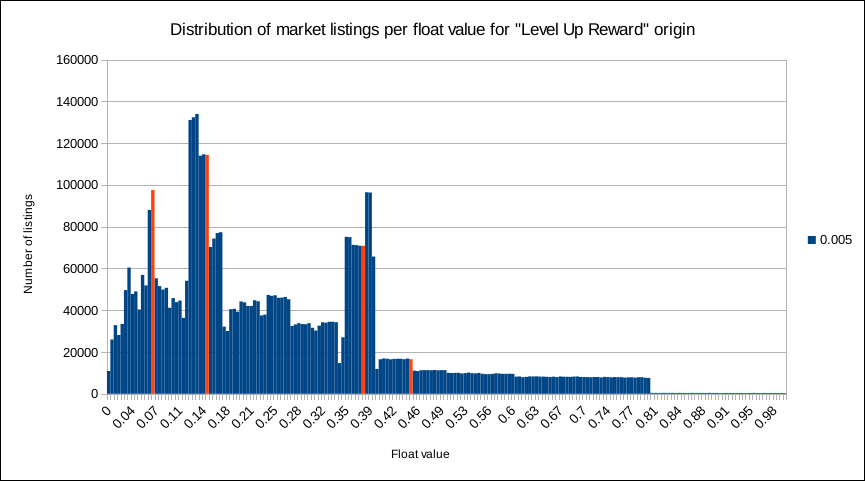
Image 9
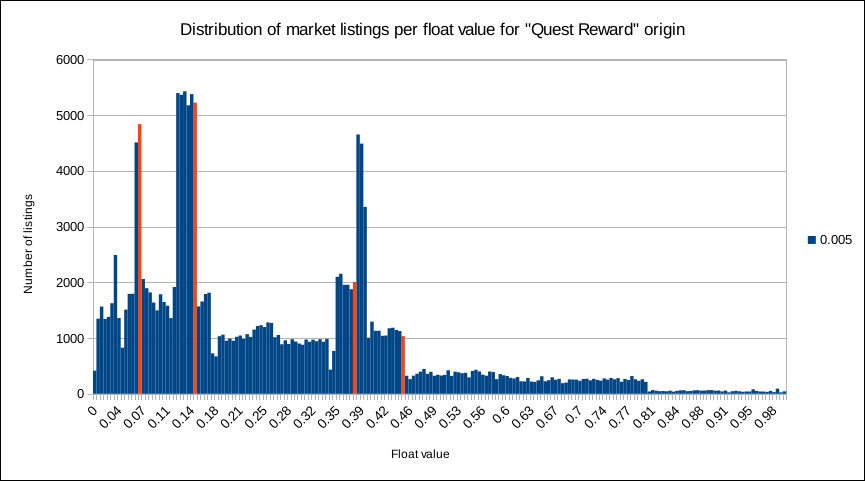
Image 10
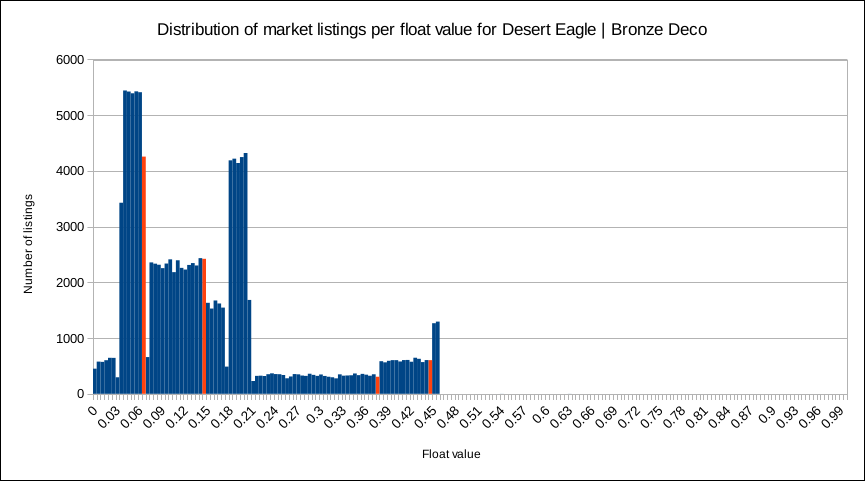
Image 11
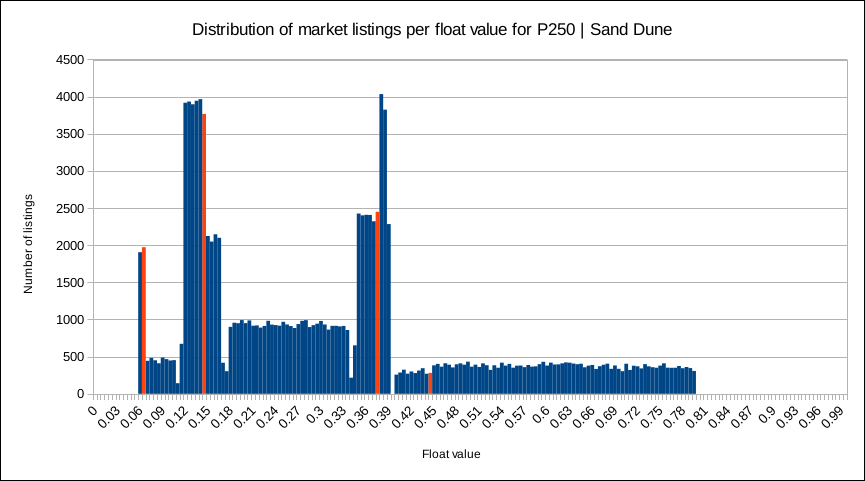
Image 12
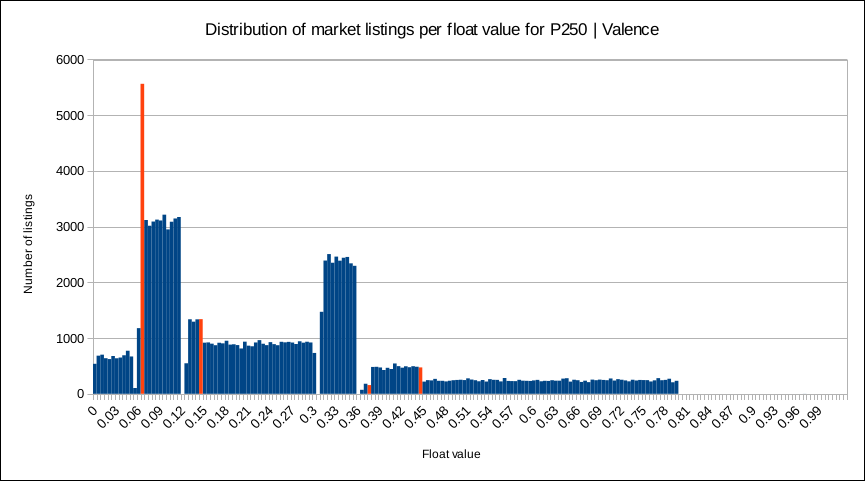
Image 13
Origin, Name, Count
0,  Timed Drop,       489297
4,  Crafted,         1504676
6,  Gifted,            16578
8,  Found in Crate,  6861295
23, Quest Reward,     177703
24, Level Up Reward, 5047973